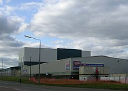
A.G. BARR p.l.c. (BAG.L)
Popping open a neon-orange can of Irn-Bru reveals the fizz and fury of A.G. BARR, the Scottish soft drinks titan behind some of Britain's favourite beverages.
Is A.G. BARR p.l.c. a good stock for a UK beginner?
The honest version: Popping open a neon-orange can of Irn-Bru reveals the fizz and fury of A.G. BARR, the Scottish soft drinks titan behind some of Britain's favourite beverages.
Over about 2 years to 2026-07-31. This is the share price only - reinvesting the dividends would add to it. Past performance is not a guide to the future, and it could just as easily have fallen.
Based on beta - how much the price swings versus the whole market. Bumpier isn't bad; it just means a rougher ride, which matters more the sooner you might need the money.
Prices move on results, news and the mood of the whole market - no single headline explains a day, and a quiet week is usually just noise, not a signal.
wider international reach for core brands like Rubicon
shifting health trends lead to permanent drops in sugary drink consumption
What does A.G. BARR p.l.c. do?
Famous for its secret recipe orange soda alongside newer brands like Rubicon and Cocktail House, this company quenches British thirsts to generate steady revenue. Selling soft drinks to supermarkets, corner shops, and pubs across the country brings in the money. Keeping an eye on how well they manage rising ingredient and manufacturing costs is the smart move here.
On our factor screen it looks strongest on income and quality, and weakest on momentum.
- ✓Pays a dividend - about 2.9% a year
- ✓Growing - revenue up about 5% over the year
- ✓Low debt - a sturdier balance sheet
- iconic, long-standing brands with deep consumer loyalty
- healthy gross margin above forty percent
- steady dividend payer for income-minded watchers
- further government taxes or health guidelines targeting sugary drinks
- inflation pushing up transport and manufacturing overheads
- intense competition from supermarket own-brand alternatives
What do A.G. BARR p.l.c.'s numbers mean?
Does A.G. BARR p.l.c. pay a dividend?
Yes - A.G. BARR p.l.c. currently pays a dividend of about 2.9% a year (the yearly payout as a share of the price). A dividend is a slice of profit handed to shareholders; the yield moves as the price moves, and a company can cut or stop it.
More in Consumer Defensive
 Altria Group
 McCormick & Company, Incorporated
 The Coca-Cola Company
 Kenvue Inc.
 Philip Morris International Inc.
 Monster Beverage Corporation
 Target Corporation
 PepsiCo, Inc.
What are the scenarios for A.G. BARR p.l.c.?
An illustrative range for the year ahead, with the assumption behind each case — not a prediction or a price target.
What are the pros and cons of A.G. BARR p.l.c.?
How many points the write-up makes each way — a balance check, not a score or verdict.
- iconic, long-standing brands with deep consumer loyalty
- healthy gross margin above forty percent
- steady dividend payer for income-minded watchers
- lower market volatility than the wider stock exchange
- recent earnings showed a dip compared to the previous year
- exposed to fluctuating costs for ingredients and packaging
- heavily reliant on the competitive UK beverage market
- further government taxes or health guidelines targeting sugary drinks
- inflation pushing up transport and manufacturing overheads
- intense competition from supermarket own-brand alternatives
The write-up's own warning lights — if these start happening, the case above changes.
- consecutive quarters of falling revenue despite rising prices
- permanent loss of profit margin due to runaway supply costs
Built from public filings & market prices, checked for an education-only tone, and never a price target. How we make these →
This plain-English summary was auto-generated on 2026-08-01 from public data and checked for an education-only, no-advice tone (the figures above carry their own, usually fresher, 'as of' date). It's information, never a recommendation.